Analysis: Spring Floods Exacerbate Raw Sewage from Factory Farms Washing into Gulf of Mexico
Analysis: Spring Floods Exacerbate Raw Sewage from Factory Farms Washing into Gulf of Mexico
Following the unprecedented climate-fueled flooding sweeping the Midwest this spring, Mighty Earth wanted to calculate approximately how much raw sewage is washing off America’s largest industrial factory farms into American waterways. Industrial meat production is the largest source of water pollution in the United States, yet this industry and its impacts are often left out of discussions around climate change. With the climate crises worsening and the Trump administration working to further roll back environmental regulations on industry, it is critical that the American public understand the sources and vast amounts of pollution washing into our waterways in order to hold specific companies and policymakers responsible for curbing uncontrolled industrial runoff.The map below shows the locations of company facilities and the average per facility water pollutant data reported to EPA’s TRI database within the most recent 5-year period from 2012-2017. To view each company separately, click the cog icon in the legend to turn on specific company data layers. When clicking on a facility location, scroll down the pop up box to see the pollution calculations.
To assess how much pollution is being generated annually by the facilities of America’s largest meat companies, Mighty Earth analyzed water pollutant data reported by companies to the EPA’s Toxic Release Inventory (TRI) database and annual slaughter data reported in company or industry reports to evaluate total manure waste generated by each company. We mapped this data onto NOAA’s 2019 spring flooding outlook to identify which facilities were located in flood prone areas, and how much pollution those facilities were discharging onto the surrounding landscape. Full methodology and findings are below. We found that:
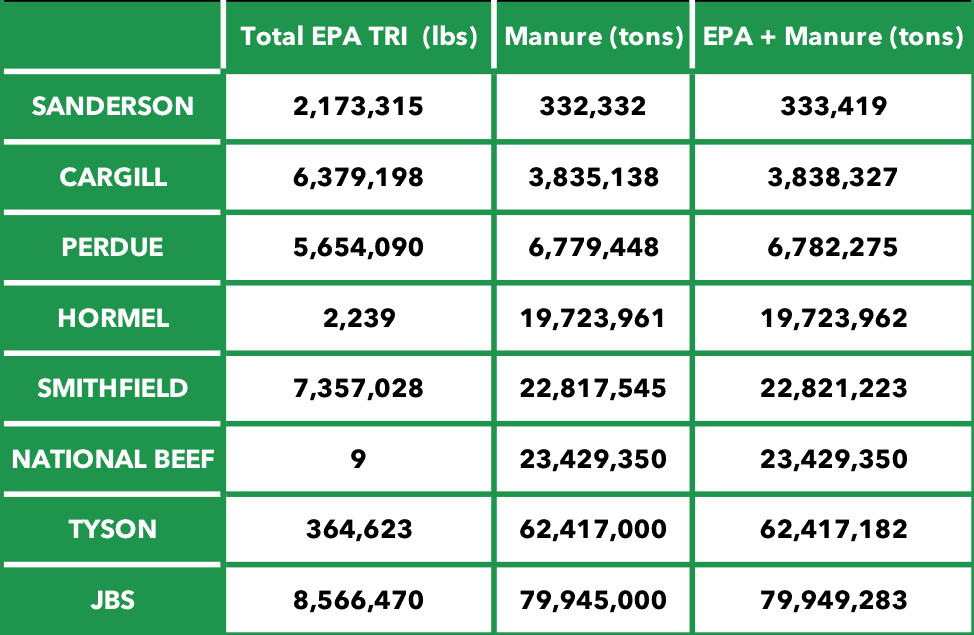
- JBS came in as the top polluter, generating approximately 80 million tons of sewage.
- In total, the top meat companies discharged nearly 220 million tons of manure and facility waste using practices that directly threaten nearby waterways with contamination, by either discharging pollutants directly into waterways, spreading pollutants onto the surrounding landscape, or storing pollutants in earthen impoundments that are highly prone to flooding and overflowing. This is approximately 500 times more sewage waste than is generated by New York City each year, yet unlike human waste, this waste from the meat industry is left untreated when it washes into waterways.
- Facilities located in the Mississippi Watershed- which flows into the Gulf of Mexico- discharged an estimated 16 million lbs of sewage directly from facilities and 128 million tons of manure from supplying livestock and poultry production facilities.
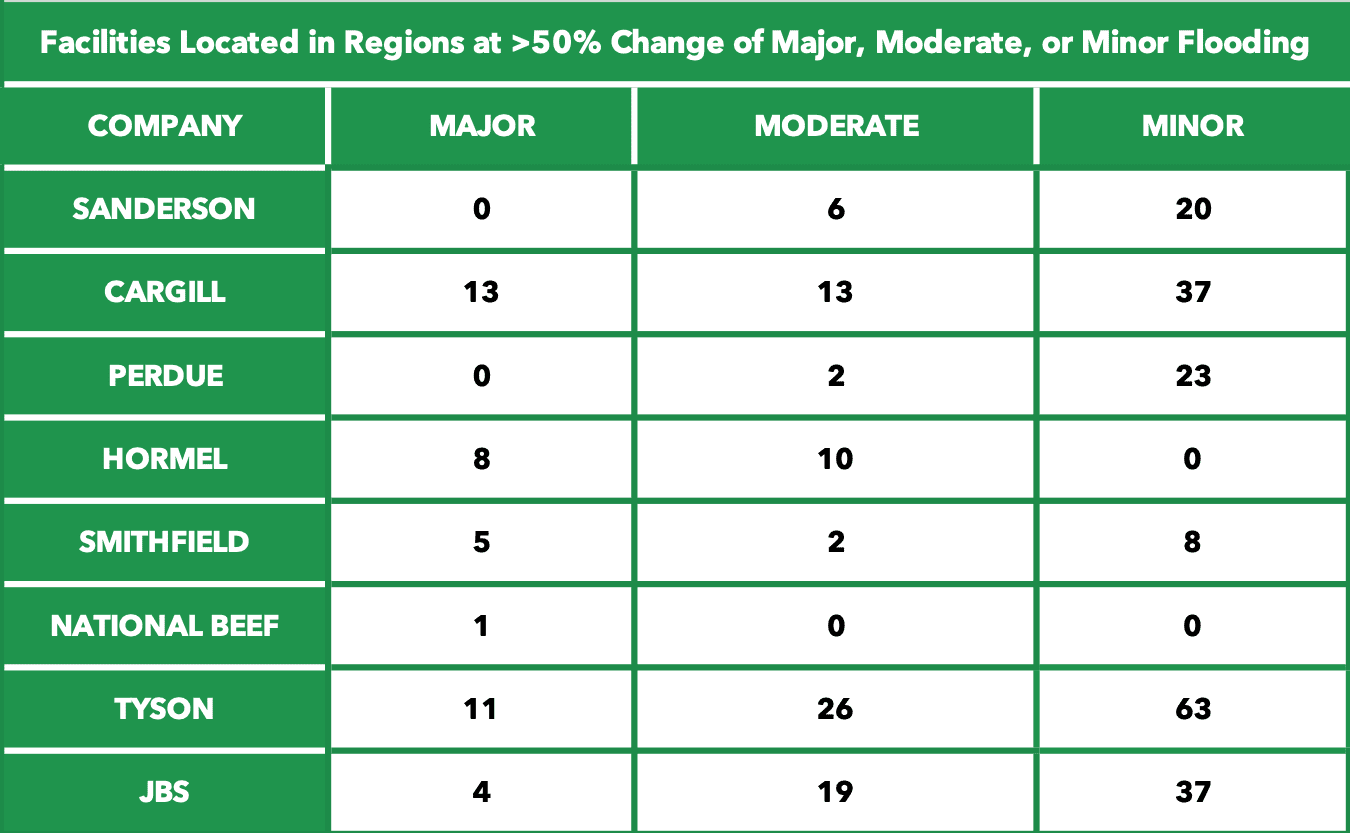
- Cargill had the most facilities concentrated in regions classified as by NOAA as ‘high risk’ for flooding in the spring of 2019, while Tyson had the highest exposure overall to flood risk areas.
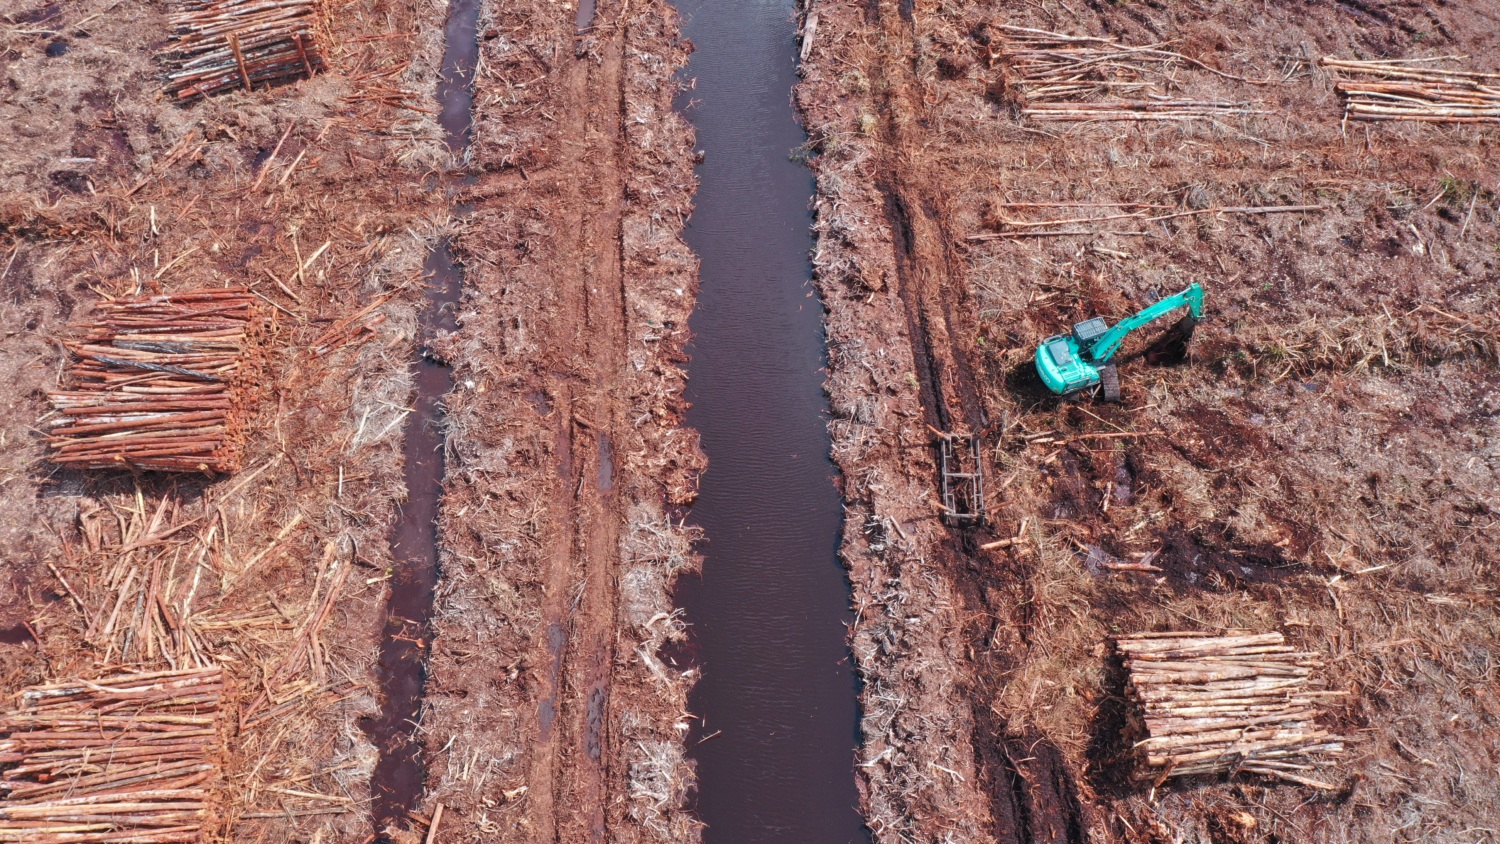
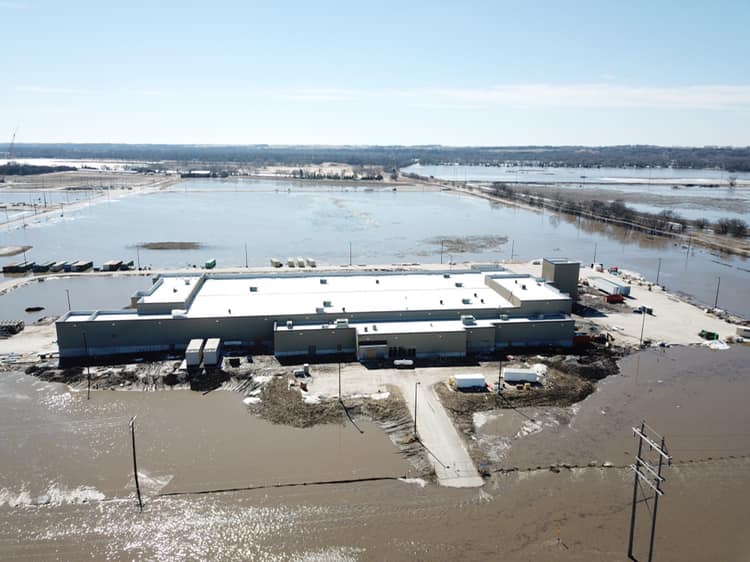
While uncontrolled pollution from the meat industry has been a long-standing threat to our waterways, catastrophic floods exacerbated by climate change and the destruction of natural landscape buffers are increasingly turning America’s agricultural regions into open sewers filled in part by the meat industry’s waste. Last fall, Hurricane Florence devastated North Carolina as manure lagoons filled with hog waste overflowed across the landscape. This spring, unprecedented flooding swept the Midwest- the heart of the meat industry’s supply chain. As a result, NOAA has already issued predictions that the annual dead zone in the Gulf of Mexico, caused largely by the meat industry’s run-off pollution washing down the Mississippi River, is going to be larger than the annual average. The bulk of the meat industry’s pollution comes from the vast quantities of feed required to raise livestock and poultry, which was the focus of Mighty Earth’s Mystery Meat II report.