Six Maps that Explain the Ivory Coast Cocoa Crisis
Mighty partnered with MapHubs to map deforestation linked to Cocoa in the Ivory Coast. Leo Bottrill and Kris Carle, MapHubs’ Founders, explain through six maps how this was possible
The best way to describe mapping Ivory Coast deforestation is a club sandwich. The ubiquitous double decker sandwich requires piling layers, turkey, bacon, lettuce, and tomato on top of each other to a precarious height, which is held in place by a cocktail stick.
Like the unwieldy club sandwich, we assembled multiple map layers to interpret the scale and causes of deforestation in the Ivory Coast. To make managing multiple datasets and maps easy, we used MapHubs – our simple map making and data management technology – which, like the proverbial cocktail stick, keeps everything in its place.
Through six maps below, here are some insights into how cocoa has impacted the Ivory Coast’s forests.
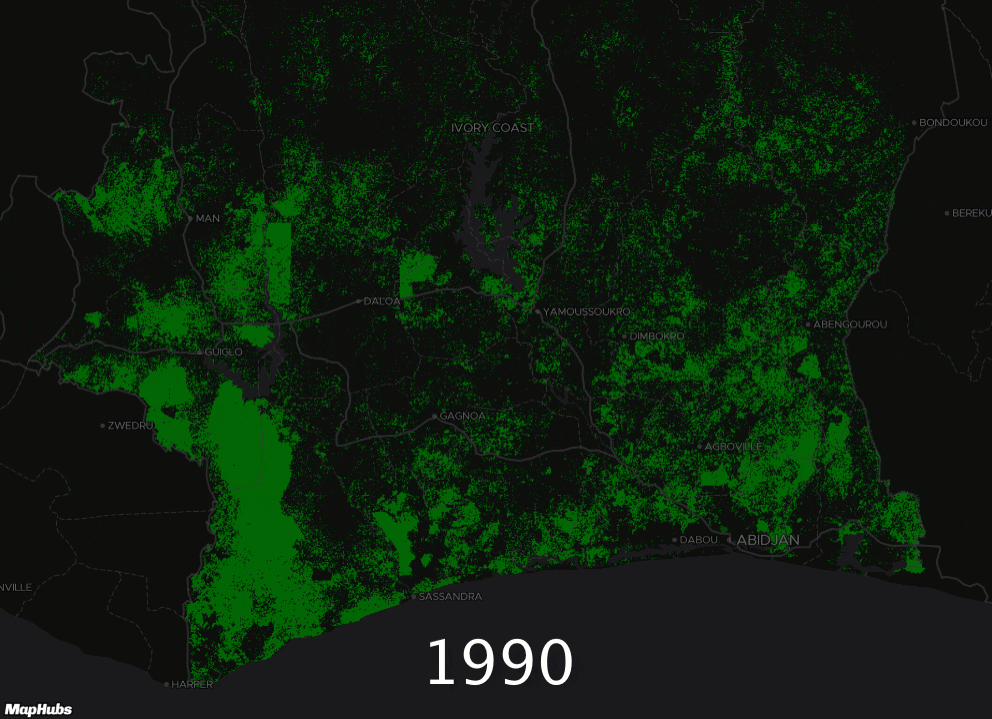
Map 1 – Ivory Coast Deforestation in 1990, 2000, and 2015
We obtained the three datasets of forest loss in the Ivory Coast in 1990, 2000, and 2015 from the National Bureau of Technical Studies (BNETD). The exact methodology was not provided, but it appears to be NASA Landsat data. By computing the area of each pixel of the image, we obtained statistics for the entire country. As of 2015, we found that 3.7% of Ivory Coast’s land area remains forest.
We then overlaid this with protected areas and summarized the values inside each protected area polygon. This allowed us to rank the protected areas by their loss for each time range, total remaining forests, and percentage of remaining forest.
We also used Tree Cover loss data from University of Maryland’s Global Land Analysis and Discovery (GLAD) Lab (http://glad.umd.edu/). This dataset has tree cover canopy density for the year 2000, and tree cover loss for each year between 2000 and 2015. For this dataset we quantified the tree cover loss for each year based on the canopy density using increments of 10 between 20% and 80%. By removing these lost areas from the 2000 baseline and summarizing what was left at each tree canopy density interval, we found a similar result of 3.6% forest remaining, when using the 70% tree canopy density threshold. As the table above illustrates, the Ivory Coast’s forest loss spiked considerably after 2011.
The table below provides a ranking of the Ivorian parks: which have the highest % age of forest left, and which have the highest volume of forest left.
Map 2 – Deforestation inside Peko National Park
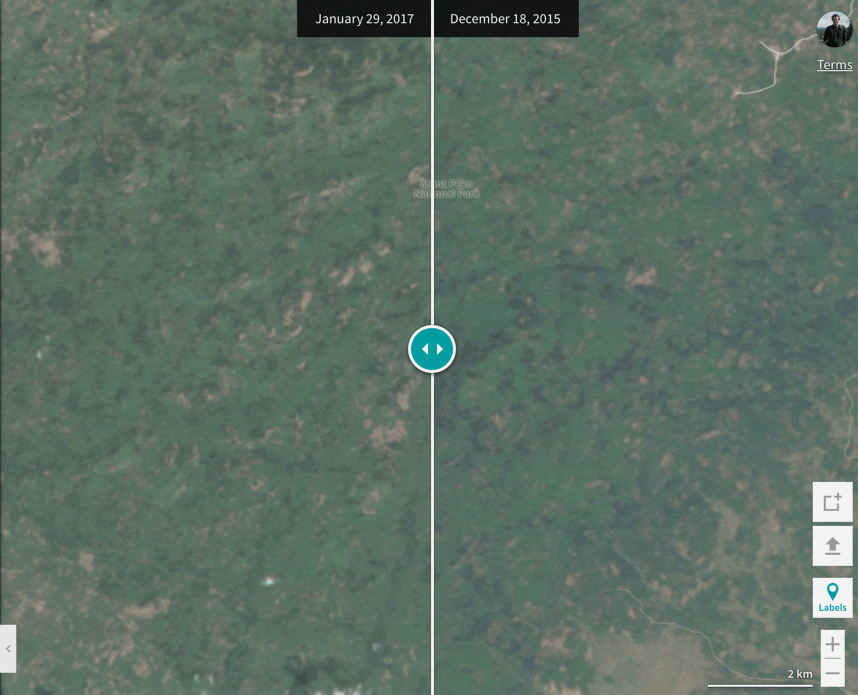
We took advantage a recent advance in satellite technology called “nano satellites”, which are tiny shoebox-sized satellites that fly in constellations around the earth. The advantage of nano satellites is they image the entire planet every day . This greatly increases the odds of obtaining a cloud-free image in the notoriously cloudy tropical rainforest. Planet (planet.com), a nano satellite company, generously gave Mighty Earth access to their imagery archive for the Ivory Coast. We used Planet’s imagery and their handy comparison tool to illustrate how Peko National Park was further deforested by encroaching cocoa growers between December 2015 and January 2017.
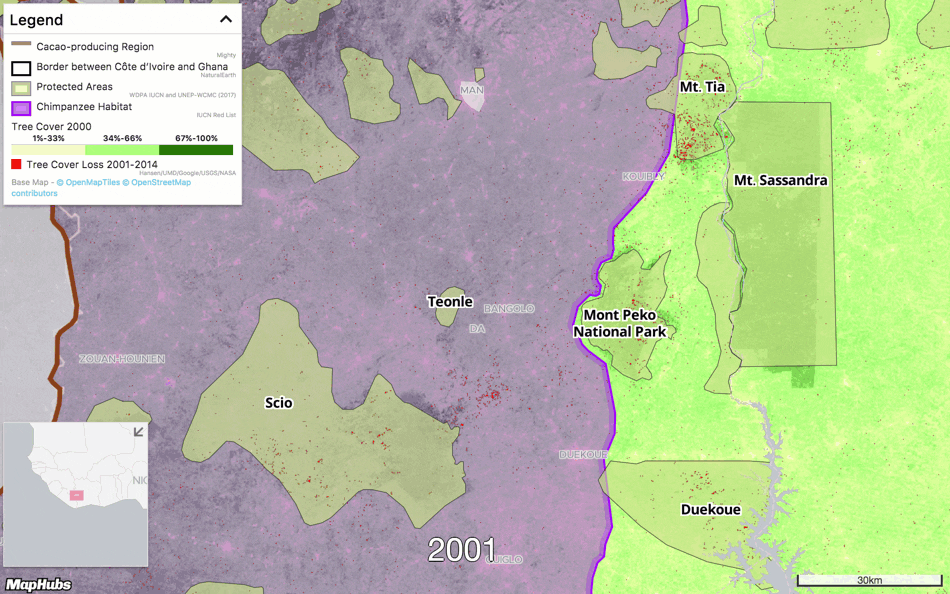
Map 3 – Mapping Cocoa in Scio Forest Reserve
When zoomed in closer, the impact of cocoa within the Ivory Coast’s protect areas becomes more apparent. This map shows deforestation inside Scio Forest Reserve caused predominantly by cocoa growers. Very little forest remains in the reserve.
Map 4 – Cocoa roads
To verify whether Scio had been converted for cocoa production, we used OpenStreetMap to map roads and settlements inside the park. DigitalGlobe – a satellite company – have made their premium high resolution base map available for tracing in OpenStreetMap. With this incredible imagery, we were able to map both the road network and human settlements throughout Scio.
We imported the road and settlement data into MapHubs. We then overlaid with park boundaries and add features such as streams and rivers. Finally, we used recent Planet imagery to identify cocoa growing areas and map cocoa households as well as the remaining forest areas. The resulting map illustrates that Scio’s forest has been almost completely converted to cocoa production with remnant forest found along the waterways and in small isolated patches.
Map 5 – Time Lapse Map for Deforestation
This gif illustrates how the pattern of deforestation inside Scio has been repeated across the Ivory Coast’s protected area system. Using GLAD Tree Cover Loss data, we animated a time series to illustrate deforestation from 2000 to 2014. The time series illustrates that during this period, deforestation largely occurred within the remaining forest reserves and national parks – the only areas left in the Ivory Coast with large stands of natural forest. Note the purple area is chimpanzee habitat, which along with southwest Ghana constitute some of the largest and last remaining chimpanzee habitats in West Africa.
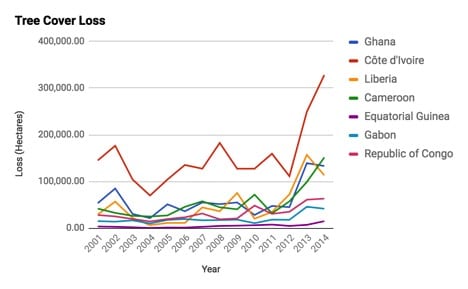
Map 6 – Deforestation across West Africa
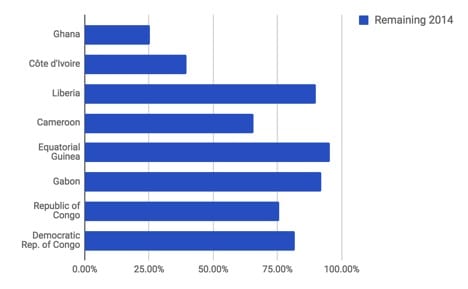
Cacao being a major driver of forest loss across West Africa with the Ivory Coast and Ghana that are the world’s #1 and #2 cacao producers have been particularly hard hit, notably in protected areas where the best quality forest remains. The bigger question is where next? As the table above illustrates, Liberia’s forests still remain largely intact but will likely come under increasing pressure from cocoa and other commodities such as oil palm.
Some final thoughts
Cocoa supply chains can be mapping to the farm level
From our experience making these maps, it’s feasible to map all of the cocoa growing areas including settlements, households, and roads. This could largely be accomplished with OpenStreetMap using DigitalGlobe imagery. We also wrote an algorithm that can identify cocoa households, which should speed up the mapping process.
Once mapped, this data would provide a basis for building deforestation-free cocoa supply chains. All cocoa associations would need to provide GPS points for all member locations, which most currently don’t. This could then be verified from a national spatial database of households.
This would be relatively easy, fast, and inexpensive to do and could potentially be replicated in other forest countries.
Monitoring Forests is about to get a lot easier.

With support from Mighty, we are building a rapid response forest alert system, which will provide regular forest monitoring. Using GLAD Alerts from the University of Maryland coupled with Planet imagery, the tool will allow Mighty to monitor hundreds of different locations for deforestation. Mighty and their partners will receive regular PDF reports documenting deforestation and rankings We plan to make this application to other be used by government agencies, cocoa growers and purchasers, and watchdog organizations. Our goal is to make forest monitoring effective, simple, affordable to any group wishing tackling deforestation. If you would like more information, please contact us here.
MapHubs is a pretty handy cocktail stick for your maps
On just this one project, we’ve used over 50 map layers and made 25 interactive maps. When combined with other Mighty campaigns, we are talking a lot of maps and data layers, which can be complicated to maintain.
Mighty use MapHubs Pro to store and manage all of their map layers and interactive maps, which are easily found by keyword and grouped according to campaigns. While the platform is private, Mighty can publish a map such as this one publicly on their website or in social media:
If you are interested in learning more about MapHubs Pro visit our site at maphubs.com or drop us a line at info@maphubs.com.